SolarKreis
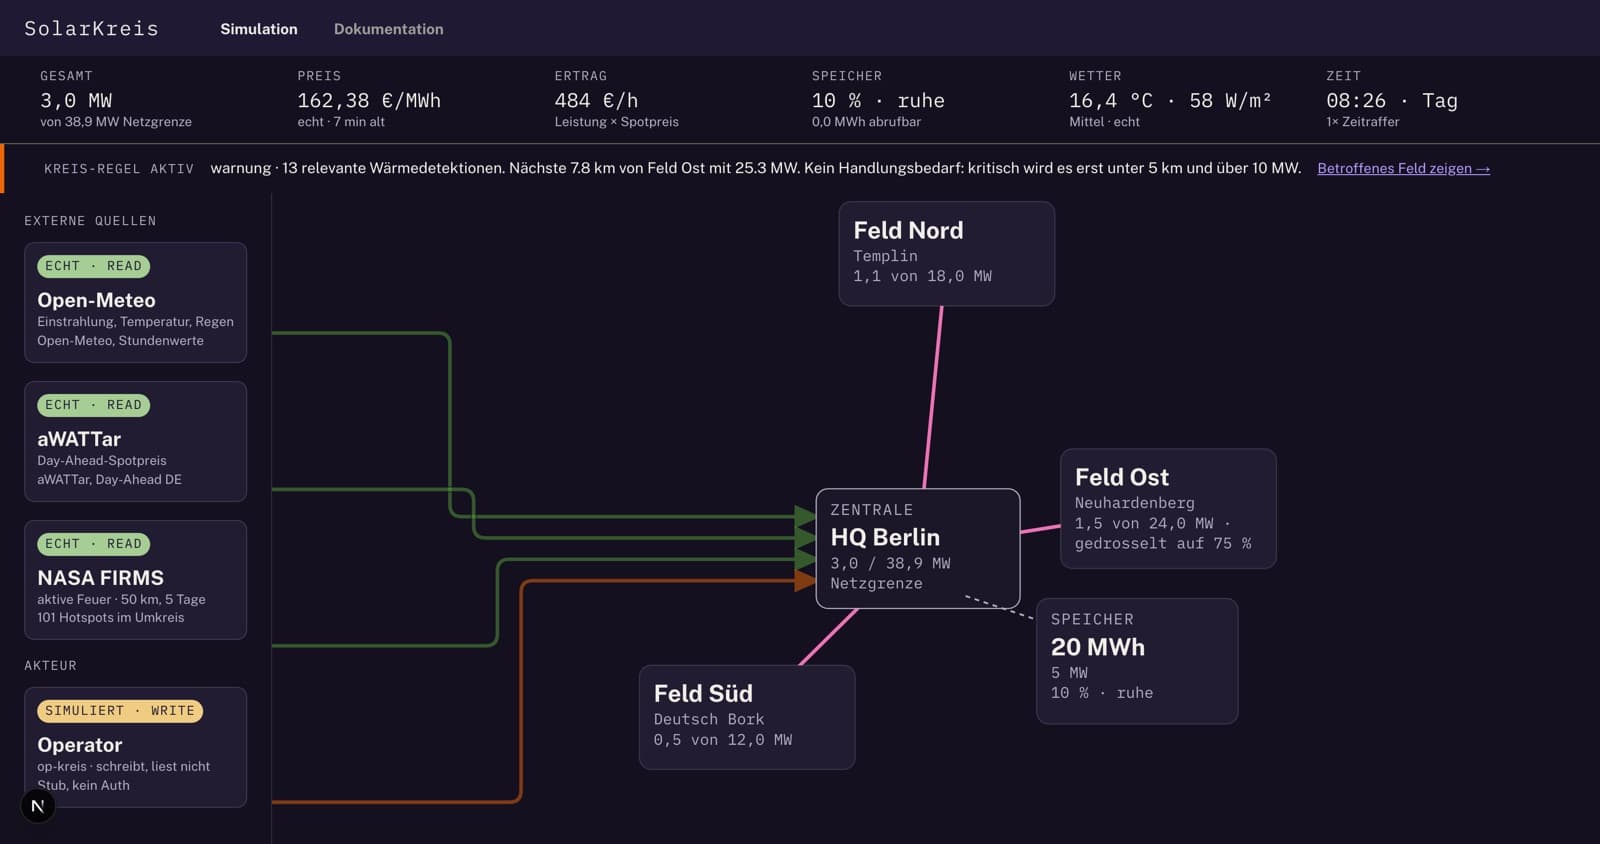
SolarKreis watches a solar park: external data, three fields, one control centre. The park is invented. The weather, the electricity price and the fire warnings are real.
A job ad set it off: someone who takes a prototype all the way into production alone — real controls, one shared data model across different manufacturers’ systems, routines that run by themselves. That is what this is, built from nothing in 24 hours. Call it a prototype sprint.
Built with
- Next.js
- React 19
- TypeScript
- Event sourcing
- Open-Meteo
- aWATTar
- NASA FIRMS
- waffle tokens
- Claude Code
How it works
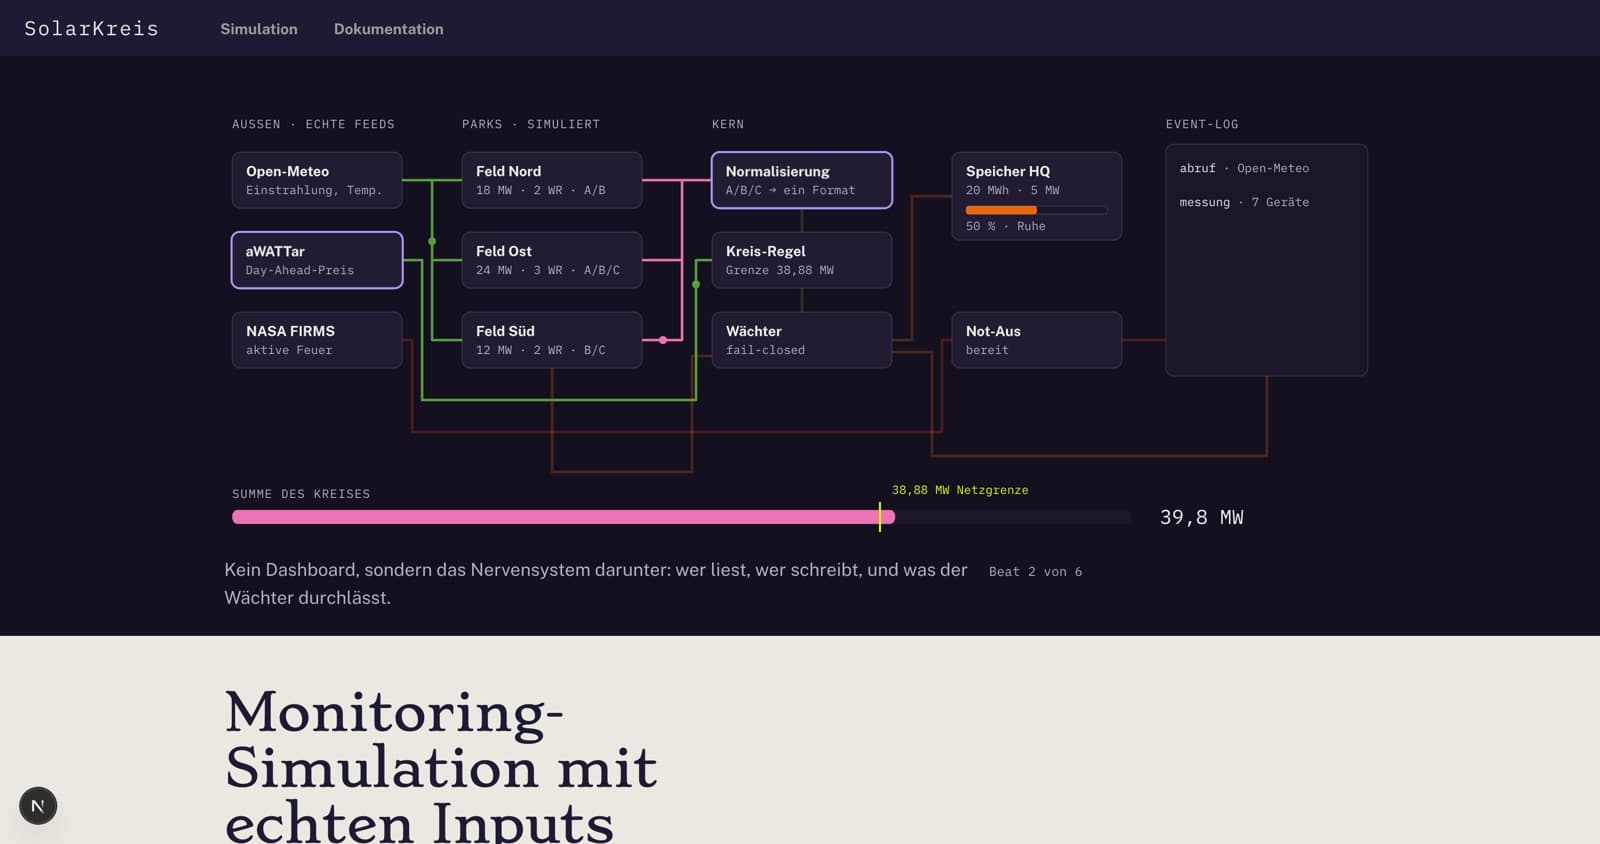
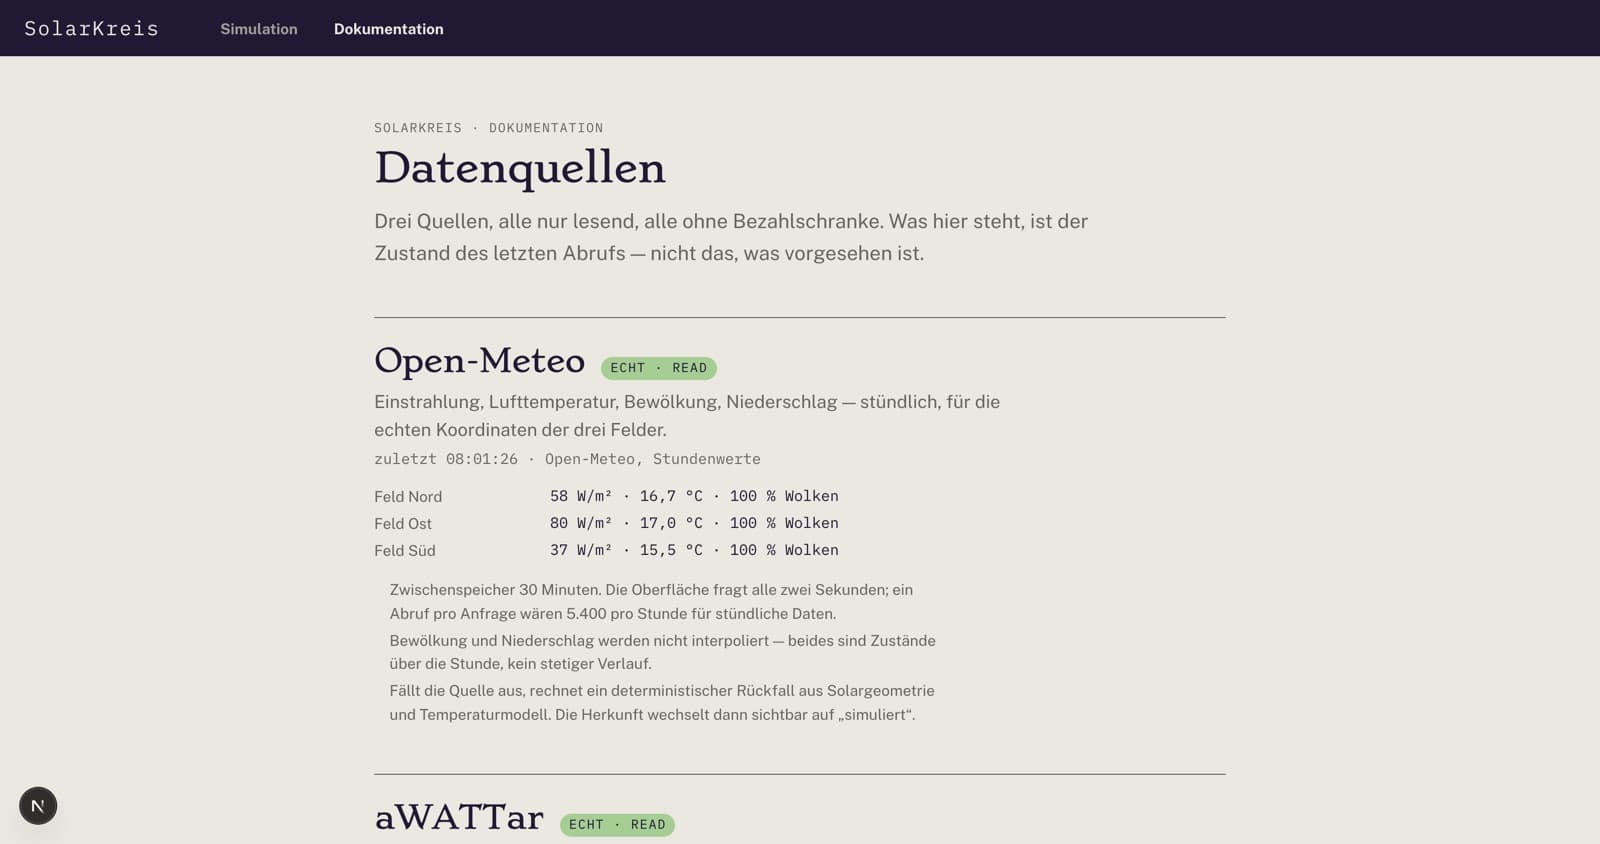
Three kinds of live data come in from outside: sun and temperature, the hourly electricity price, and fire warnings from a NASA satellite.
The output is calculated, not invented — where the sun stands, how clear the sky is, and how hot the panels get. Above 25 °C they lose efficiency, so a hot day in July yields less than a cool day in May with the same sunshine.
The equipment in the fields comes from three manufacturers, and each one reports in its own format. They are translated once, at the door. Everything behind it only knows kilowatts and degrees.
In numbers
3 fields with 7 inverters 3 vendor formats 3 external data sources 38.88 MW grid limit 39.8 MW at solstice 20 MWh storage 48 checks against the live instance 24 hours from scratch
Process
- Ideate & scope
- Wireframes & Design
- Local tests & iteration
- Connect data
- Production
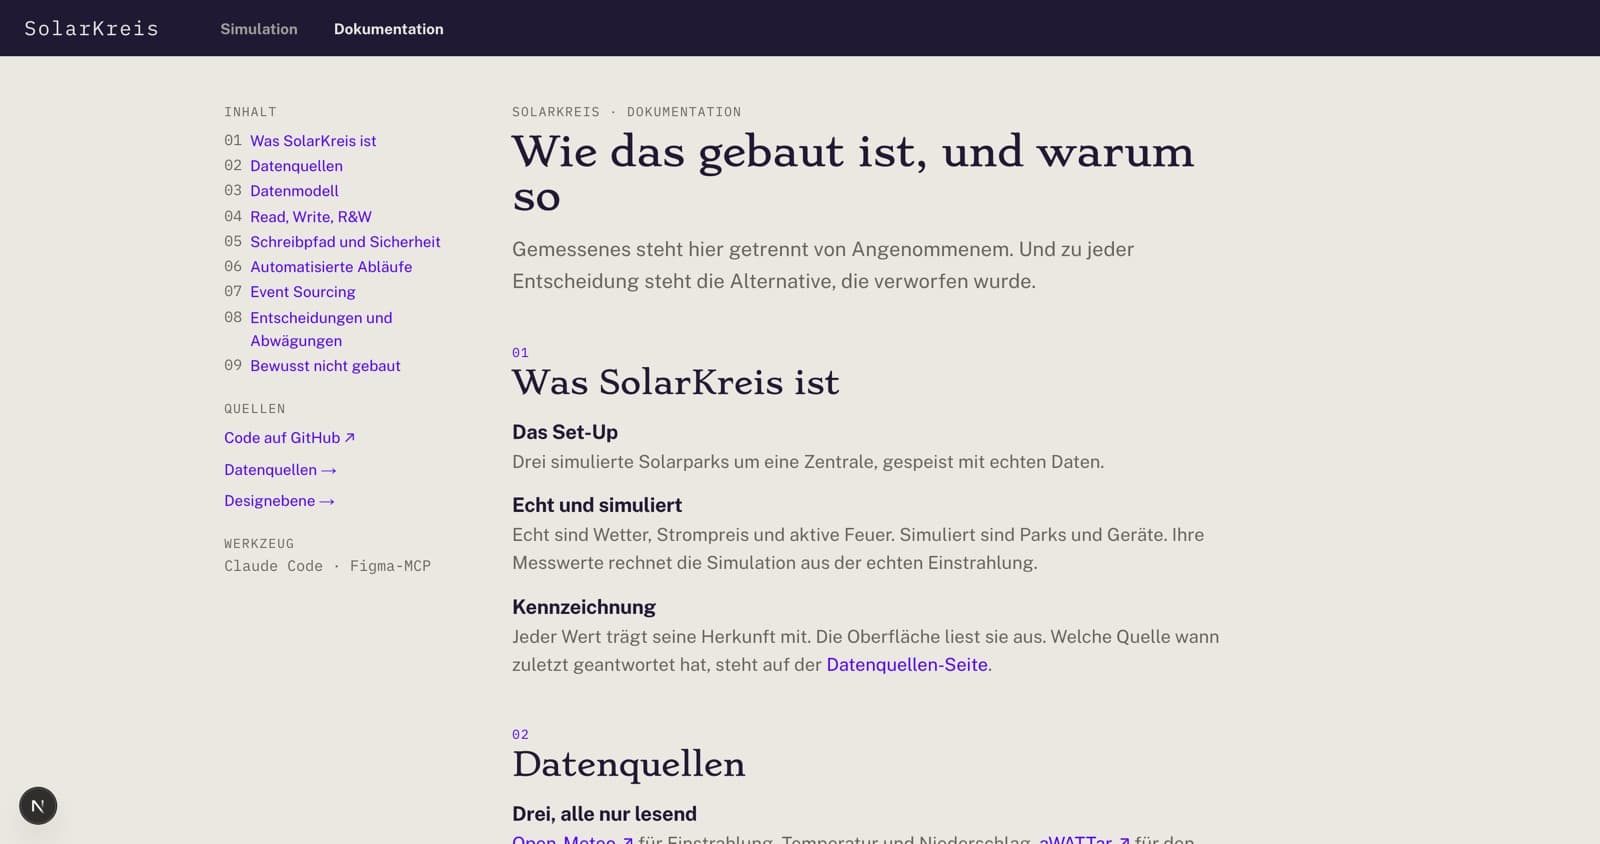
The screens were drawn in Figma before a line of code: by hand where a decision had to be made, with agents where every colour and line had to be tied to a single source. Nine text sizes, one place to change any of them. Contrast was measured, not eyeballed.
A separate document lists the decisions I made without a wireframe, written so someone can argue with them instead of me defending them.
The fire feed arrived sideways. I had been researching wildfires for a graphic novel about the boreal forest, so the NASA data was already on my desk when the question came up.
Hardest call
The hardest part was not the code. It was deciding what to simulate at all — a wind park, a solar park, or the flux towers from Scotty Creek. The subject was interchangeable; the pattern was the point.
Solar won because I kept driving past it. Along the A9 there are modules over farmland, grazing animals underneath, using the shade as much as the sun. Then the harder half started: where to stop. What came of that is the section below.
The 20 MWh of storage came from a trade article about rust batteries — iron-air cells that charge by reversing rust.
What I did not build
Three features were cut, each with the measurement that killed it.
— The glare alarm. I computed the reflection for a whole year in five-minute steps, and it came back with zero moments of glare: the motorway there runs at 51°, and the panels reflect past it. The calculation stays in the repo as the reason for the cut.
— A traffic feed. Free and easy to read, but nothing in the plant would act on it.
— A multi-day storage fallback. It would need a load model the system does not have.
What's next
Finished prototype
What can Iget out ofyour way?
Reach out